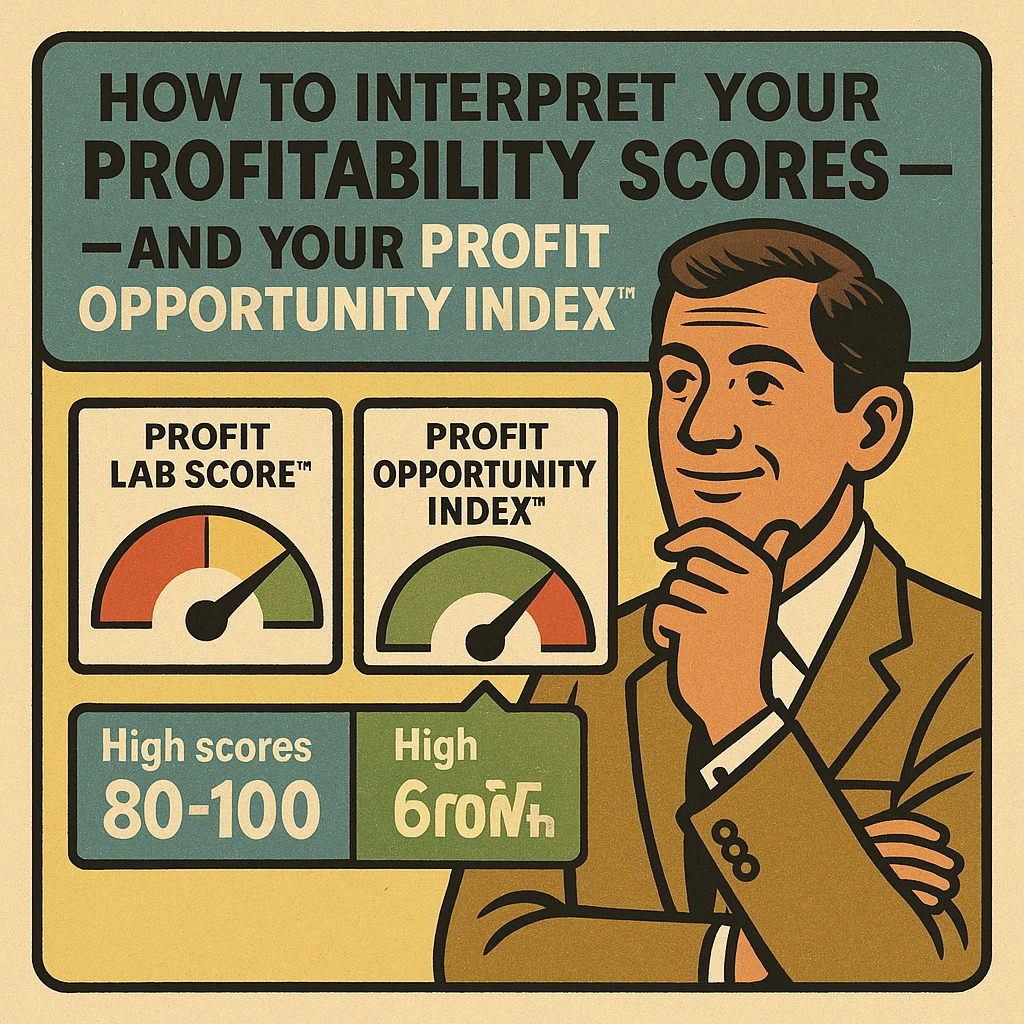
How to Interpret Your Profitability Scores — and Your Profit Opportunity Index™
Your score shows where you are today. Your Opportunity Index shows how far you can grow.
Most business assessments leave people confused. They give you a number… but not the meaning behind it. They highlight weaknesses… but not what to do next. They point to problems… but not the true opportunity.
That’s why understanding how to interpret profitability scores — along with your Profit Opportunity Index™ — is crucial.
Your Profit Lab Score™ shows the current strength of your business across five profitability pillars.
Your Profit Opportunity Index™ shows how much untapped profit you can capture by making targeted improvements.
When you understand both, you gain a complete picture:
-
Where you are now
-
Where your biggest opportunities are
-
How far you can improve
-
What steps will get you there fastest
This article breaks down how to interpret profitability scores and use them to create significant, measurable improvements in your business.
What Your Profit Lab Score™ Really Means
Your Profit Lab Score™ measures the current state of your business across:
-
Growth
-
Marketing
-
Operations
-
Pricing
-
Strategic Leverage
A high score indicates strong systems and alignment.
A low score reveals foundational issues that limit profitability, efficiency, and scale.
High Scores (80–100):
Your business is well-structured and performing at a strong level. Improvements will be more about refinement than radical change.
Mid-Range Scores (55–79):
You have solid strengths, but clear inefficiencies or bottlenecks are limiting your profit potential. This is where targeted improvements can create fast gains.
Lower Scores (0–54):
Multiple pillars need attention.
The good news? The lower your score, the more opportunity you have to unlock dramatic improvements.
Introducing the Profit Opportunity Index™:
Your roadmap to hidden, unused profit
While your Profit Lab Score™ measures your business’s current health, the Profit Opportunity Index™ measures something different:
❗ How much additional profit your business could realistically unlock by implementing your roadmap.
According to the system documentation:
The Profit Opportunity Index™ is a forward-looking score between 0 and 100 that represents the amount of untapped profit potential inside your business. A higher score doesn’t mean you’re failing — it means your business has massive upside and clear opportunities you can capture.
How to Interpret Profitability Scores
Put simply:
-
Low Profit Lab Score™ → High Opportunity Index™ → Big growth potential
-
High Profit Lab Score™ → Low Opportunity Index™ → Business already running efficiently
Your Opportunity Index is the strategic opposite of your Profit Lab Score™—and you need both to know what to fix AND what you stand to gain.
Interpreting Your Profit Opportunity Index™
Your Opportunity Index falls into one of three ranges:
61–95: High Improvement Potential
You have major opportunities to increase your profitability.
This is where the fastest and biggest wins lie — and your roadmap will prioritize high-impact actions first.
Understanding Your Profit Oppor…
36–60: Moderate Improvement Potential
Your business has a stable foundation, but there are several areas where focused improvements will create meaningful, measurable gains.
15–35: Optimization Potential
Your business is already operating efficiently.
Your roadmap will focus on fine-tuning, strengthening margins, and gaining competitive advantage.
How the Profit Lab Score™ and Opportunity Index Work Together
These two metrics give you the full picture:
| Measurement | What It Tells You | Why It Matters |
|---|---|---|
| Profit Lab Score™ | Current health and strength of your business | Shows where things are strong or weak today |
| Profit Opportunity Index™ | Future upside and untapped potential | Shows where to focus for the biggest ROI |
High Lab Score + Low Opportunity Index
→ You’re already efficient; improvements are refinements.
Low Lab Score + High Opportunity Index
→ You have major profit opportunities waiting to be captured.
This dual-measurement system ensures you get clarity on both your current state and your future potential.
A Practical Example
Based on the official documentation…
Let’s imagine a firm, Innovate Solutions.
Understanding Your Profit Oppor…
-
Profit Lab Score™: 45
-
Profit Opportunity Index™: 65
What this means:
-
Their current operations have significant gaps (low score).
-
These gaps create a huge opportunity for improvement (high Opportunity Index).
-
By following their roadmap, they could realistically increase profitability by up to 65% within the next 6–12 months.
This is the power of understanding both scores.
How to Use Your Scores to Improve Profitability
Here’s the step-by-step process to turn your results into action:
1. Identify Your Lowest Pillars
These areas create the biggest drag on profit.
2. Look at the Opportunity Index for Each Pillar
The higher the opportunity score in a pillar, the bigger impact that improvement will make.
3. Follow the Order in Your Roadmap
Your roadmap prioritizes actions by:
-
Ease of execution
-
Potential financial impact
-
Dependencies
-
Sequential logic
4. Start with the Fastest Wins
This builds momentum.
Your Opportunity Index highlights these clearly.
5. Use the 90-Day and 6-Month Check-Ins
These allow the system to:
-
Track your progress
-
Re-measure your improvements
-
Update your recommendations
-
Strengthen your benchmark position
-
Improve the machine learning engine based on your results
6. Celebrate improvements in both scores
As you take action:
-
Your Profit Lab Score™ should increase
-
Your Opportunity Index™ should naturally decrease
Why?
Because you’re capturing opportunities one step at a time.
Key Takeaway
Understanding your profitability score is important —
but understanding your profit opportunity is what drives growth.
Your Profit Lab Score™ shows where you stand today.
Your Profit Opportunity Index™ shows how far you can go — and how fast.
Together, they give you:
-
Clear insight
-
Personalized direction
-
Prioritization
-
Confidence
-
A roadmap tailored to your business
-
A measurable path to higher profitability
This is not guesswork.
This is a system.
Want to See Your Profit Opportunity Index™?
Take the free Profit Lab Score™ and get:
-
Your full profitability score
-
Your Profit Opportunity Index™
-
A pillar-by-pillar breakdown
-
A personalized improvement roadmap
-
Step-by-step instructions tailored to your business
-
90-day and 6-month follow-ups automatically
And if you’re among the first 50 business owners on our launch list, you’ll receive a free Lite Profitability Roadmap ($295 value).
Recent Comments
Recent Comments
Archives
Categories
Profit Lab Score™ your partner to discover lost profitability in your business!
Copyright © 2026 Profit Lab Score™
Profit Lab Score™ your partner to discover lost profitability in your business!
Copyright © 2026 Profit Lab Score™